Causal-Gene Certainty, Not Statistical Significance: Decomposing the Value of Genetic Evidence
science
7,192 genetically supported targets, frozen in 2015 and followed for eleven years
1. The question
Human genetic evidence roughly doubles a drug’s probability of success. The finding originates with Nelson et al. (2015) and has been repeatedly confirmed — by King et al. (2019) and by Minikel et al. (2024), who report a relative success rate of 2.6× — to the point where it is now the default premise of target review across the industry.
But “success rate” is a composite outcome:
P(approved) = P(somebody is willing to try) × P(it works once tried)
The first term is a decision about what to work on — judgement, allocation of resources, institutional behaviour. The second is technical delivery — the compound, the dosing, the trials, the regulator. If the effect is concentrated in the first term, the “doubling” reflects the fact that scientists believe in genetics. If it is concentrated in the second, it reflects genetics actually predicting biological truth. The two carry opposite implications for how genetic evidence should be used.
Most existing work estimates only the product. This study introduces the intermediate variable and pulls the two apart.
2. Data and method
The supplementary tables of Nelson 2015 supply both the exposure and the intermediate variable at the same point in time:
| Element | Operationalisation | Scale |
|---|---|---|
| Universe | NCBI Entrez human protein-coding genes | 20,945 |
| Exposure | Table S12: pre-2015 OMIM/GWAS gene–disease associations | 7,192 genes |
| Intermediate | Table S13: latest development stage in the Pharmaprojects pipeline slice (705 MeSH indications) | 1,823 genes |
| Outcome | Becoming the mechanistic target of an approved drug | — |
Outcome side. Pre-2015 approvals are taken from the S13 status field; 2016–2021 from the official NCATS FDA_NDAs annotation table; 2022–2026.8 standardised by hand drug by drug and checked against the FDA’s official annual new-drug lists.
Confounding control. Stratification on the Finan 2017 druggable genome (Tier 1/2/3A/3B/outside), with Mantel-Haenszel stratified adjustment.
Grading the evidence. Number of associated diseases (breadth); source type (OMIM Mendelian variants versus GWAS common variants), the latter serving as a coarse proxy for certainty about the causal gene.
Reasons for failure. Open Targets stopReasons (a BERT classification of 31,867 terminated trials), mapped to target genes through the ClinicalTrials.gov → MeSH → DrugBank chain.
The outcome is estimated once in each direction. Retrospective: the share of the 1,823 genes that ever entered the pipeline and were eventually approved. Prospective: the conversion rate over the following 11 years for the 574 genes that were in flight in 2015 — on this basis the exposure definitely precedes the outcome in time, and is not contaminated by the reverse-causal path in which already-drugged targets attract more genetic research.
3. Cohort composition
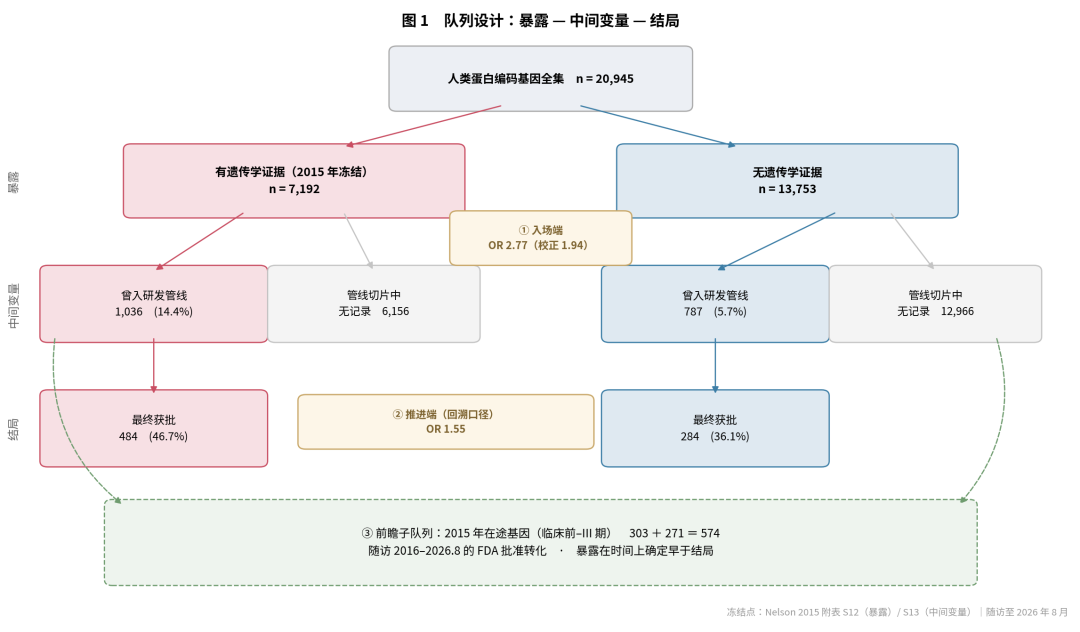
Of the 7,192 genes with genetic evidence:
| Status in 2015 | Genes | Share |
|---|---|---|
| Already drugged | 440 | 6.1% |
| In flight (preclinical–phase III) | 303 | 4.2% |
| Tried, all attempts now stopped | 293 | 4.1% |
| No record in the pipeline slice | 6,156 | 85.6% |
The fourth row needs careful naming: S13 is a slice restricted to 705 indications, not a complete census of the pipeline (see §8).
4. The total effect
Genome-wide, 6.7% of genes with genetic evidence eventually became the target of an approved drug, against 2.1% of those without — a ratio of 3.26. That is the same order of magnitude as the 2–2.6× reported in the literature.
This is a prevalence-basis figure: the numerator includes approvals accumulated over the decades before 2015, and it cannot be compared directly with an incidence-basis figure computed over a follow-up window.
5. The two-stage decomposition
Entry stage. 14.4% of genes with evidence had ever entered the pipeline against 5.7% without, a crude OR of 2.77 (p < 10⁻⁹⁰); after stratified adjustment for druggability, OR = 1.94. About three-tenths of the apparent effect comes from genes with genetic evidence simply being more druggable in the first place.
Advancement stage (retrospective). Among genes that had entered the pipeline, 46.7% versus 36.1% were eventually approved, OR = 1.55.
Advancement stage (prospective). Of the 574 genes in flight in 2015, the 2016–2026 conversion rate was 12.5% versus 9.6%, RR = 1.31, 95% CI [0.82, 2.09], p = 0.29.
The effect decays monotonically along the process (2.77 → 1.55 → 1.31) and is not significant by the time we reach the cleanest prospective test. The gap between the retrospective and prospective estimates corresponds roughly to the size of the reverse-causal path.
6. The split by type of evidence
Stratifying the prospective cohort by the source of the evidence decomposes that pooled null result into two components pointing in opposite directions.
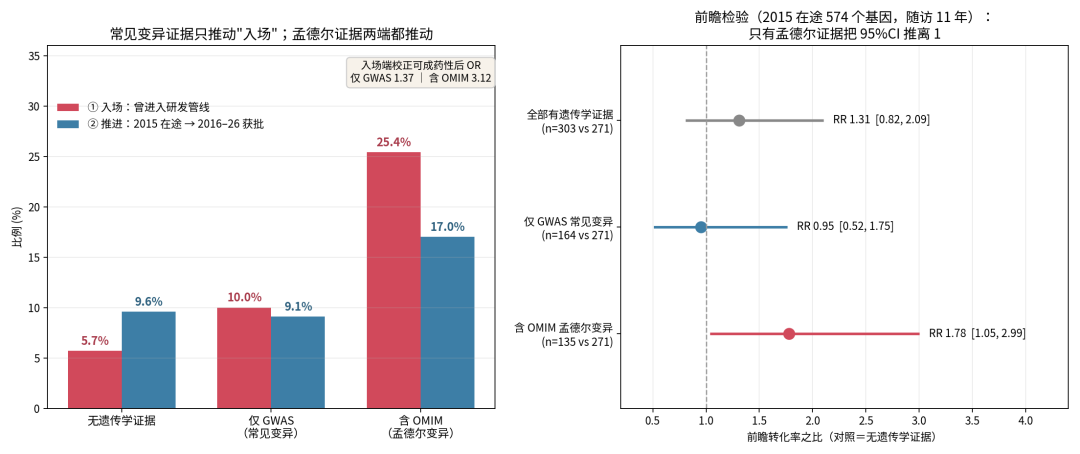
| Genes in flight in 2015 | n | 2016–2026 conversion | RR [95% CI] | p |
|---|---|---|---|---|
| No genetic evidence | 271 | 9.6% | reference | — |
| GWAS only (common variants) | 164 | 9.1% | 0.95 [0.52, 1.75] | 1.00 |
| Includes OMIM (Mendelian variants) | 135 | 17.0% | 1.78 [1.05, 2.99] | 0.036 |
The entry stage stratifies the same way (after Mantel-Haenszel adjustment for druggability):
| Type of evidence | Genes | Entry rate | Adjusted OR |
|---|---|---|---|
| GWAS only | 5,128 | 10.0% | 1.37 |
| Includes OMIM | 2,064 | 25.4% | 3.12 |
Mendelian evidence works at both ends (entry OR 3.12, advancement RR 1.78). Common-variant evidence works only at entry (OR 1.37), with a null effect on advancement (RR 0.95). The pooled RR of 1.31 is the average of the two.
This independently reproduces the conclusion of King et al. (2019): where the causal gene is clear — Mendelian traits, GWAS associations resolved to a coding variant — the effect of genetic evidence exceeds twofold, and for Mendelian associations the prospective test holds.
It also dissolves the apparent contradiction with the 2.6× phase I → launch relative success rate reported by Minikel et al. (2024). First, Minikel uses strict target–indication pairing (trait–indication similarity ≥ 0.8) where this study uses a broad gene-level basis, which dilutes the signal. Second, Minikel explicitly reports that relative success improves with confidence in the causal gene, and has little to do with effect size or allele frequency. The OMIM/GWAS distinction is precisely a coarse-grained proxy for that dimension — not a difference in effect size, but a difference in whether the gene assignment is certain.
7. Effect heterogeneity across druggability tiers
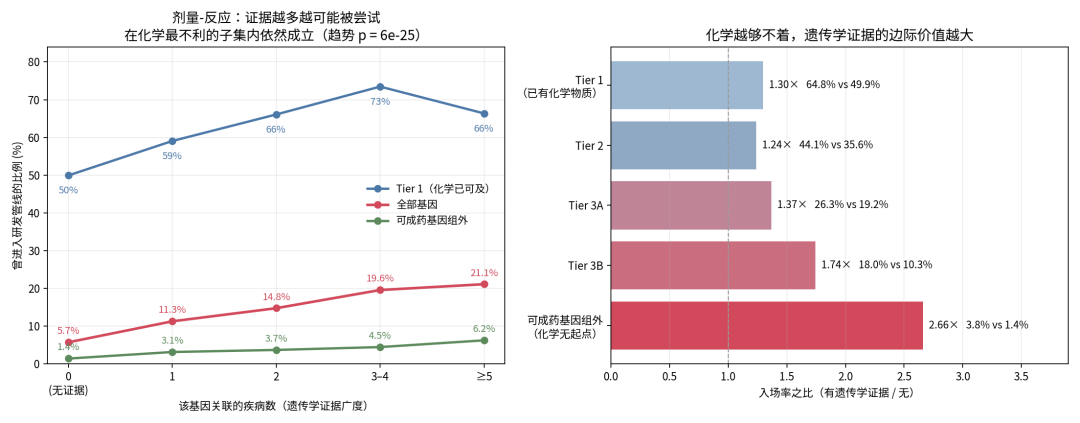
| Druggability tier | Entry rate, with evidence | Entry rate, without | Ratio |
|---|---|---|---|
| Tier 1 (existing chemical matter) | 64.8% | 49.9% | 1.30× |
| Tier 2 | 44.1% | 35.6% | 1.24× |
| Tier 3A | 26.3% | 19.2% | 1.37× |
| Tier 3B | 18.0% | 10.3% | 1.74× |
| Outside the druggable genome | 3.8% | 1.4% | 2.66× |
The marginal value of genetic evidence rises as chemical accessibility falls. One self-consistent explanation is the cost of the decision: where a compound is already to hand, the cost of trying is low and weak evidence suffices to start; with no chemical starting point a route has to be built from nothing, and only a strong biological rationale can push that through.
Druggability itself matters far more than genetic evidence. Among genes that do have evidence, the entry rate is 64.8% in Tier 1 and 3.8% outside the druggable genome — a 17-fold gradient. Druggability sets the absolute magnitude; genetic evidence sets the ranking within a given magnitude.
Dose–response. As the number of associated diseases goes 0 → 1 → 2 → 3–4 → ≥5, the entry rate goes 5.7% → 11.3% → 14.8% → 19.6% → 21.1%. A robustness check restricted to the 11,398 genes outside the druggable genome still shows the gradient (1.4% → 3.1% → 3.7% → 4.5% → 6.2%, trend p = 6×10⁻²⁵), ruling out the explanation that genes with more evidence just happen to be more druggable.
8. Validating the completeness of the pipeline record
Interpreting the fourth row — the 6,156 “no record” genes — depends on how completely S13 covers the pipeline, so this was tested externally.
Intersecting with DrugBank’s “human mechanistic targets of approved drugs” (624 genes) gives 95 hits; among the 265 Tier 1 genes recorded as having no pipeline entry, 32 (12.1%) are already the target of an approved drug, including FDPS (the target of nitrogen-containing bisphosphonates), CACNA1S, SCN4A, KEAP1, GGCX, TUBB1, GANAB and PDE8B.
The cause is structural: S13 covers only the 705 MeSH indications that overlap the genetic trait vocabulary, so a gene developed only outside that range is recorded as having no entry. The row should therefore be read as “no record within this pipeline slice”, and its absolute size overstates the genuinely unexplored space.
The effect on the main result was assessed by two checks:
- Differentiality. Among the approved targets identified by DrugBank, S13 misses 26.4% in the evidence arm and 42.4% in the no-evidence arm. The omission is differential, and its direction inflates the entry-stage effect.
- Sensitivity. Recomputing with every DrugBank approved target forcibly recorded as “ever attempted” moves the crude OR from 2.77 to 2.67 and the druggability-adjusted OR from 1.94 to 1.91.
The main effect is robust.
The cleaned candidate list. Starting from “no record + Tier 1 + associated with ≥ 3 diseases” and removing ADME genes and known DrugBank targets leaves 32 genes (LMNA, TNFSF12, SIK3, CLK2, CAMK1D, CSK, KLKB1, BLK, DNMT3A, BMPR1B and others). This list is a screening output, not a conclusion: MYH7 is still on it, and mavacamten (approved 2022) acts on that target — it survived only because the DrugBank snapshot predates the approval.
ADME contamination. Nearly half the high-evidence Tier 1 genes are drug-metabolism genes (SLC22A5, CYP2C19, UGT1A1, SULT1A1 and so on). Their strong genetic evidence comes from pharmacokinetic-phenotype GWAS — plasma concentrations, metabolite levels — rather than from disease-mechanism associations, which limits their value as therapeutic targets. Any ranking function that optimises only “strength of evidence × druggability” will systematically float them to the top: what trait the genetic association is with matters more than how strong it is. A flag column for ADME genes has been added to the delivered data.
9. The record of failure
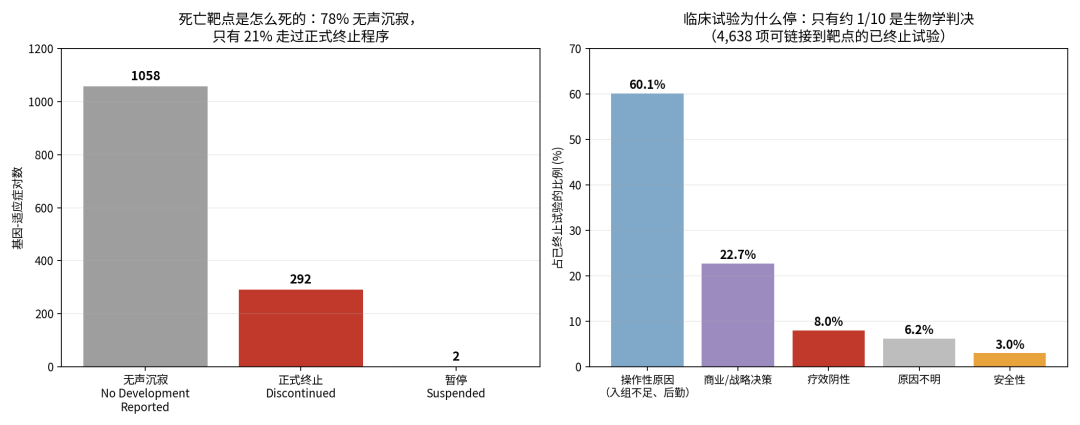
Mode of exit. Across the 1,352 gene–indication pairs belonging to the 554 dead pipeline genes, 78% (1,058 pairs) are “No Development Reported” — silent lapse. Only 292 went through a formal Discontinued process.
Reasons for stopping (4,638 terminated trials linkable to a target): operational reasons — insufficient enrolment, logistics, staffing — 60.1%; commercial or strategic decisions 22.7%; negative efficacy 8.0%; reason unknown 6.2%; safety 3.0%. In the public record, only about one stop in ten constitutes a biological refutation of the target hypothesis.
The blind spot in the record. Of the 554 dead targets only 3 can be linked to a registered trial stop carrying a classified reason; and of the 663 genes that do have a stop record, 338 are targets of approved drugs. Almost all attributable failure records come from projects that got far enough to leave one — the earlier and more completely a target dies, the less public trace it leaves. The bulk of the reasons for failure is systematically missing from the public data.
The percentages above represent only the linkable subset: the MeSH → DrugBank mapping is biased towards marketed and late-stage drugs, and early compounds are systematically missed.
10. Phase and revival
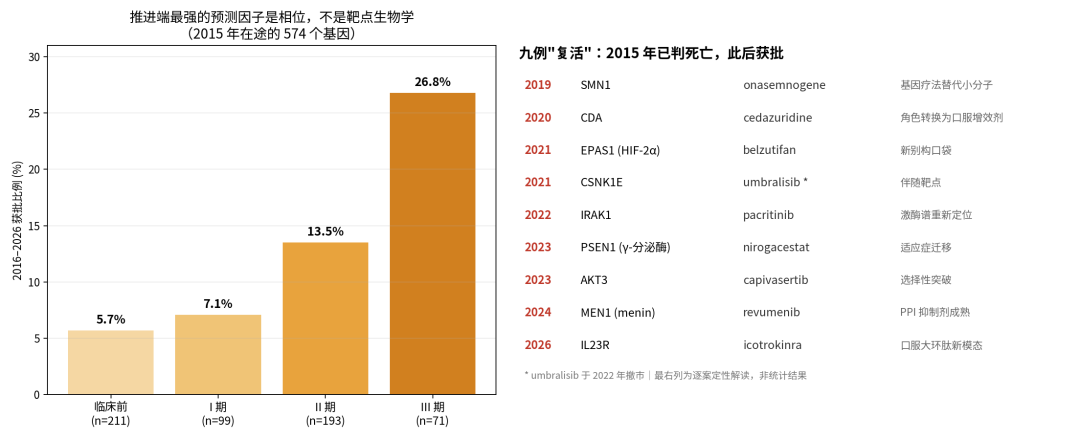
For genes in flight in 2015, conversion increases strictly with the phase reached: preclinical 5.7% → phase I 7.1% → phase II 13.5% → phase III 26.8%. Phase is the strongest predictor at the advancement stage.
Of the 554 pipeline genes already judged dead in 2015, nine were approved between 2016 and 2026 (six, or 2.0%, within the 293-gene subset that had genetic evidence). Reading the cases one by one, the qualitative judgement is that every one corresponds to a change in technical state — a new pocket, a new modality or a new indication — rather than the original hypothesis being revalidated along the original route. That judgement is an interpretation, not a statistical result.
A base rate of 2.0% means revival is a rare event, and not enough to justify persisting with a failed direction.
11. Discussion
- The total effect is real (3.26× on a prevalence basis) and consistent with three independent papers.
- The effect occurs mainly at the entry stage. Adjusted for druggability, entry OR is 1.94; the pooled prospective effect at the advancement stage is not significant.
- “Genetic evidence” is not a single variable. Mendelian evidence works at both ends (entry OR 3.12, advancement RR 1.78); common-variant evidence drives only entry (OR 1.37) and is null on advancement (RR 0.95). The dimension that does the work is certainty about the causal gene, not the statistical strength of the association.
- The effect is largest where chemistry is least favourable (2.66× outside the druggable genome versus 1.30× in Tier 1). Druggability sets the absolute magnitude (a 17-fold gradient); genetic evidence sets the ranking within it.
- The advancement stage is determined by phase and by execution: in the public record, only about one trial stop in ten is a verdict on efficacy or safety.
Three implications for the practice of target selection:
- A GWAS association is not insurance against late-stage risk. Its effect on getting a programme started is measurable; its effect on getting through phase II was not detected.
- Distinguishing types of evidence is worth more than refining an evidence score. Changing the scoring dimension from “number of associations” to “confidence in the causal gene” is more useful than weighting association strength more finely.
- The marginal value of genetic evidence is concentrated in the chemically hardest targets. In Tier 1 its incremental information is close to redundant.
For automated hypothesis-generation systems: a ranking function that optimises only “strength of evidence × druggability” will systematically float ADME genes to the top, and will report a set of already-marketed targets as unexplored opportunities (§8). The more finely tuned the scoring function, the better hidden both errors become.
12. Limitations
- The exposure is defined by OMIM/GWAS only, and excludes target hypotheses arising from functional biology (cell and animal models).
- The intermediate variable is systematically incomplete (§8). Differentiality and sensitivity checks were performed and the main effect holds, but the absolute size of the “no record” row is overstated.
- The retrospective basis carries reverse causation. The prospective basis hedges against it but does not quantitatively remove it.
- The prospective basis has few events (64 conversions). The non-significant pooled RR of 1.31 should be read as “not detected”, not “ruled out”: the upper bound of 2.09 still accommodates a moderate positive effect. The OMIM subgroup’s RR of 1.78 has a lower bound of 1.05, only barely excluding 1 — a marginal result needing a larger sample to confirm.
- The OMIM/GWAS split is a coarse proxy for certainty about the causal gene. The two groups differ systematically in disease spectrum (rare versus common), competitive landscape and regulatory route (orphan-drug designation), any of which might independently explain part of the difference in effect. This study cannot separate them.
- Druggability tiers use Finan 2017 data, which postdates the cohort freeze and may partly reflect chemical progress made after 2015, slightly understating how difficult the “no record” group was.
- The outcome is a broad gene-level definition (the gene becomes the mechanistic target of any approved drug) and does not require a match with the genetically associated disease. Strict same-indication pairing could not serve as the primary analysis because of the limited overlap between the two MeSH vocabularies (207/2,531) — another possible source of the difference from Minikel 2024.
- Coverage of the stop-reason chain is biased towards late-stage drugs; the percentages in §9 represent only the linkable subset.
- Research intensity is an uncontrolled confounder. Genes that make it into OMIM/GWAS are themselves more studied, and more-studied genes are more likely to be developed. Separating the two requires bibliometric covariates unavailable in this environment. All effect sizes here should therefore be read as associations, not causes.
- The 2022–2026 approvals table was standardised by hand and individual target assignments are debatable; the revival mechanisms in §10 are a qualitative reading.
13. Materials for reproduction
Data sources: Nelson MR et al., Nat Genet 2015, ng.3314, supplementary tables S12/S13 · NCATS FDA_NDAs (2010–2021) · FDA official annual new-drug lists (2022–2026, for verification) · Open Targets stopReasons · dhimmel/clintrials (214,889 trials) and a DrugBank snapshot · Finan C et al., Sci Transl Med 2017 druggable genome · NCBI Entrez Gene.
References: Nelson et al. 2015 Nat Genet 47:856–860; King et al. 2019 PLOS Genet 15:e1008489; Minikel et al. 2024 Nature 629:624–629.